How to Create a Knowledge Graph for Analytics

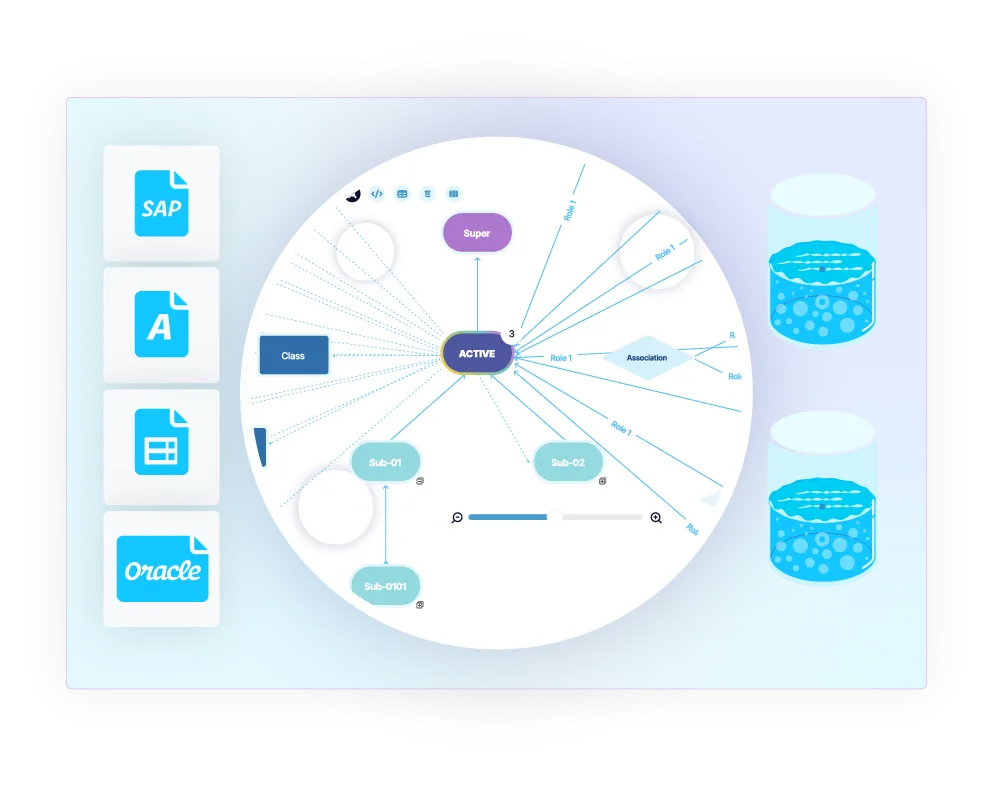
Knowledge graphs have emerged as a powerful foundation for connected insights and advanced analytics, enabling businesses to overcome the limitations of traditional data management approaches. Let’s explore how to create an effective knowledge graph for analytics.
Knowledge Graph Resources
Are you building an Enterprise Knowledge Graph? Download our one-page overview on Fluree’s Knowledge Graph tooling.
Understanding Knowledge Graphs
A knowledge graph is a structured representation of data that emphasizes the relationships between different entities. Unlike traditional databases that store information in isolated tables, knowledge graphs connect data points in meaningful ways that mirror how information is naturally related in the real world.
Why Knowledge Graphs Matter for Analytics
Traditional data systems often struggle with several key challenges:
- Data and metadata become siloed, inconsistent, or unexplainable
- Systems lack the interoperability required for holistic decision-making
- Security is fragmented across multiple systems, increasing risk and compliance issues
Knowledge graphs address these challenges by creating a unified, contextual view of your data that enhances analytical capabilities.
Steps to Create a Knowledge Graph for Analytics
1. Define Your Ontology and Taxonomy
The foundation of any effective knowledge graph is a well-designed ontology—a formal representation of knowledge with categories, properties, and relationships. This step involves:
- Identifying key entities in your domain
- Defining relationships between these entities
- Establishing properties that describe each entity
- Creating hierarchical classifications (taxonomies)
This foundation is critical as it determines how your data will be organized and connected, directly impacting the insights you can extract.
2. Clean and Prepare Your Data
Before integrating data into your knowledge graph, you’ll need to:
- Identify and resolve inconsistencies
- Standardize formats and terminology
- Remove duplicates and irrelevant information
- Transform data to align with your ontology structure
The quality of your knowledge graph is directly tied to the quality of the data it contains.
3. Map and Transform Structured Data
Structured data from databases, spreadsheets, and business applications needs to be mapped to your knowledge model:
- Create mapping rules between source data and target ontology
- Transform data to fit the knowledge graph schema
- Establish identity resolution processes to identify when different records refer to the same entity
- Preserve provenance information to track data origins
4. Extract and Integrate Unstructured Content
Organizations possess vast amounts of unstructured data in documents, emails, and digital assets that contain valuable information:
- Use natural language processing (NLP) to extract entities and relationships
- Apply auto-tagging to classify content according to your taxonomy
- Connect unstructured content to your knowledge graph structure
- Maintain links to source materials for reference
5. Implement Storage and Query Capabilities
Your knowledge graph needs an infrastructure that supports:
- Efficient storage of graph-structured data
- Flexible query capabilities that leverage graph relationships
- Scalability to accommodate growing data volumes
- Performance optimization for analytical workloads
6. Connect to Analytics Tools and Applications
To derive value from your knowledge graph:
- Integrate with business intelligence platforms
- Develop APIs for application access
- Create visualization tools to explore relationships
- Enable both technical and business users to leverage insights
7. Establish Governance and Security
Effective governance ensures the ongoing quality and security of your knowledge graph:
- Define access controls at granular levels
- Implement data lineage tracking
- Create validation rules to maintain data quality
- Establish change management processes
Tools and Technologies for Knowledge Graph Analytics
While building a knowledge graph from scratch is possible, specialized tools can accelerate implementation and maximize value. Fluree’s suite of knowledge graph solutions offers comprehensive capabilities:
- Fluree ITM (Intelligent Taxonomy Manager) helps create and manage data ontologies with best-in-class taxonomy management and dynamic vocabulary integration.
- Fluree Sense focuses on structured data, using AI to identify, classify, clean, and map data to your target knowledge model—transforming siloed information into clean, connected records.
- Fluree CAM (Content Auto-Tagging Manager) handles unstructured digital assets, using NLP to classify and tag content, making previously inaccessible insights available for analytics.
- Fluree Core provides the underlying platform to store, manage, share, and query your knowledge graph, connecting high-quality data to downstream applications and business users.
Best Practices for Knowledge Graph Analytics
To maximize the value of your knowledge graph for analytics:
Start small but plan for scale - Begin with a well-defined domain where you can demonstrate value quickly, but design with expansion in mind.
Prioritize flexibility - Use configurable data pipelines that can adapt to your unique business needs and evolve over time.
Focus on collaboration - Create shareable data products that connect different parts of your business to break down silos.
Invest in integration capabilities - Ensure easy import/export from various sources with built-in connectors to maximize data availability.
Automate where possible - Use automation to expand and evolve your data models, consumers, and sources over time.
Conclusion
Creating a knowledge graph for analytics represents a significant advancement over traditional data management approaches. By connecting information in meaningful ways, organizations can discover insights that would otherwise remain hidden in disconnected systems. While implementing a knowledge graph requires careful planning and specialized expertise, the analytical capabilities it enables can transform decision-making across your organization.
Whether you choose to build in-house or leverage solutions like Fluree’s knowledge graph platform, the journey toward connected, context-rich analytics begins with understanding how your data relates and building the infrastructure to represent those relationships. In today’s complex data environment, knowledge graphs provide the foundation needed to extract maximum value from your information assets.
Expert Consultation
Are you looking to build an Enterprise Knowledge Graph? Reach out to speak with one of our Knowledge Graph experts:
Stay in the loop
Weekly insights on enterprise AI, knowledge graphs, and data intelligence.