Why Enterprise AI Hallucinates (And How to Fix It)

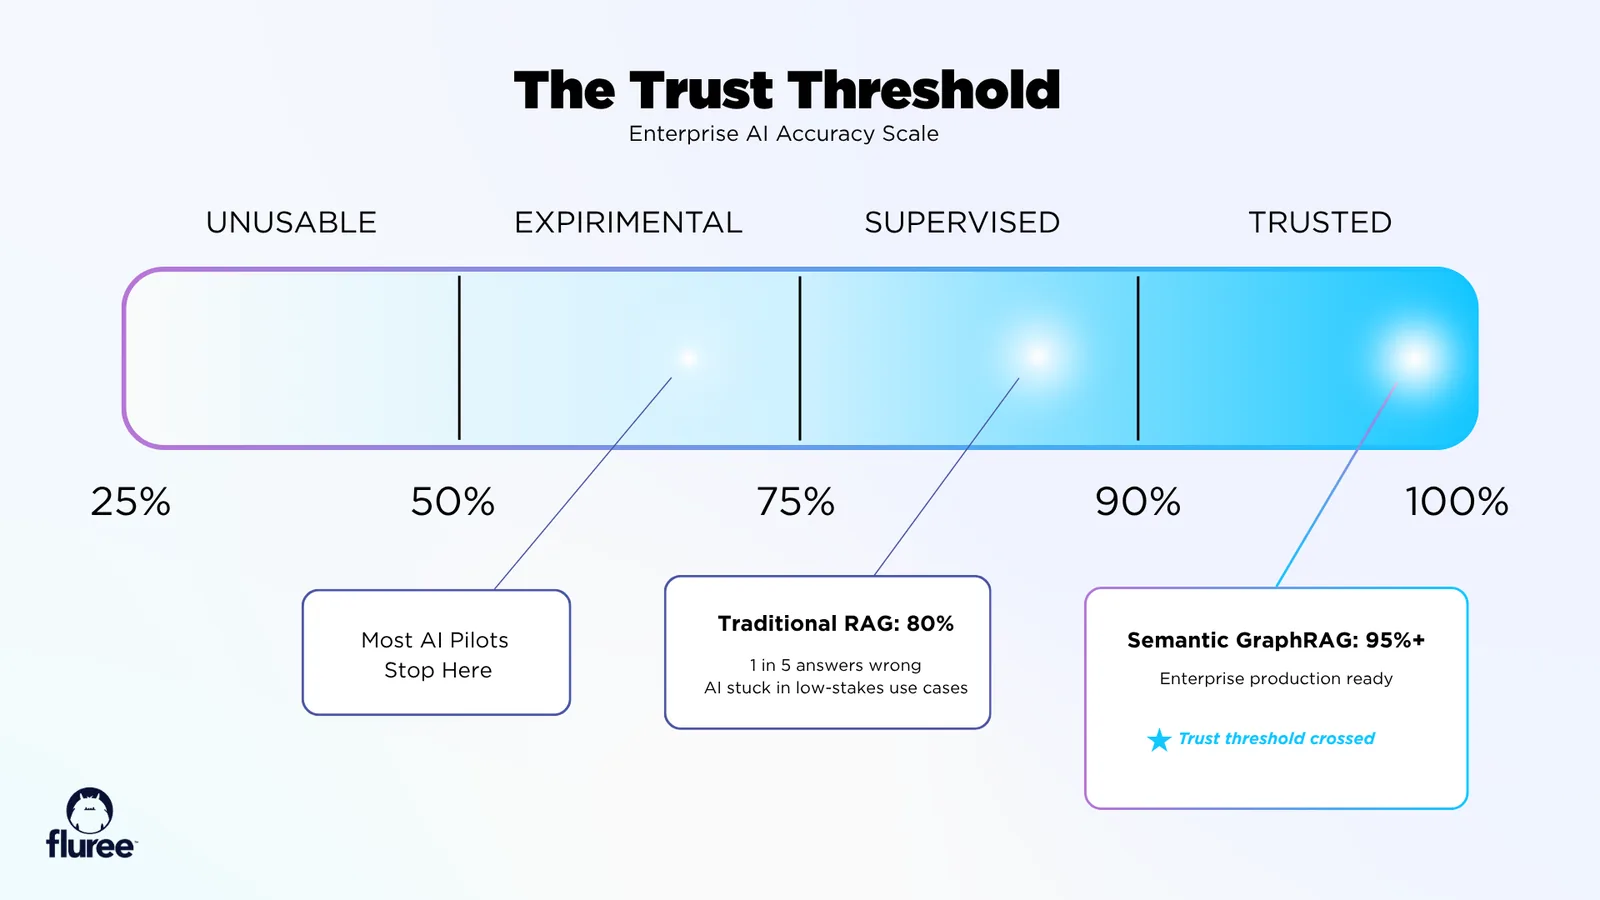
If you’ve deployed an AI assistant for your business, you’ve probably experienced this moment: An executive asks a simple question about customer data, and your LLM confidently delivers an answer that’s completely wrong. It cites customers that don’t exist. It invents product features. It contradicts itself across different conversations. And worst of all, it does this with unwavering confidence. Welcome to the enterprise AI hallucination problem—the single biggest barrier preventing enterprises from trusting AI for critical decisions.
The problem isn’t your LLM. It’s how you’re feeding it information.
In this deep dive, we’ll explore why traditional Retrieval Augmented Generation (RAG) struggles with enterprise data, and how semantic GraphRAG — detailed in Fluree’s whitepaper Semantic GraphRAG: Everything You Need to Know — achieves accuracy rates of 95%+—making hallucinations virtually extinct.
The Two Hidden Flaws in Traditional RAG
Traditional RAG fails for two distinct reasons, depending on whether you’re working with unstructured documents or structured enterprise data. Despite the different approaches, both problems lead to the same outcome: the 80% accuracy ceiling Fluree measured in its April 2024 RAG study — where one in five answers is wrong.
Flaw #1: Vector Search Without Context (The Unstructured Data Problem)
Let’s start with how RAG handles documents—PDFs, contracts, emails, meeting notes. The process seems logical at first glance.
Traditional document RAG begins by breaking your documents into smaller pieces, typically paragraphs or sentences. These chunks are then converted into vectors, which are essentially mathematical representations that capture the semantic meaning of the text. When you ask a question, the system converts your question into a vector as well, then searches for chunks whose vectors are mathematically similar. The system hands those matching chunks to the LLM, which generates an answer based on what it found.
Sounds reasonable, right?
Here’s where it breaks down: vector similarity isn’t the same as semantic accuracy.
Consider a real-world scenario. Your legal team asks:
Vector search finds these chunks with high similarity scores:
Based on these highly similar chunks, the LLM confidently responds: "Your liability limit with Johnson Industries is $5M annually."
But here’s what the LLM doesn’t know, and can’t know from isolated chunks:
The chunk contains the number, but the LLM lacks the context that makes that number meaningful.
Vector search successfully found mathematically similar text, but it failed to provide the critical metadata that determines accuracy:
The result is predictable: the LLM fills these gaps with statistically probable guesses. Sometimes it gets lucky and guesses correctly. Often, it hallucinates.
Flaw #2: Relational Databases Without Semantic Meaning (The Structured Data Problem)
Now let’s look at a different problem with the same outcome.
When your data already lives in structured systems—Salesforce, ERP, Zendesk, billing systems—vector search isn’t even the issue. Here, the problem is how relational databases store information without encoding semantic relationships between facts.
Imagine an executive asks:
Your data exists in disconnected tables scattered across multiple systems:
Traditional RAG queries each of these tables separately:
Then it hands all these disconnected results to the LLM.
Consider what the LLM actually receives: isolated facts from different systems with no explicit relationships between them. There’s no semantic meaning explaining what "High severity" actually indicates about churn risk. There’s no business context connecting overdue payments to support issues. The LLM is left to make educated guesses:
The LLM responds by making statistically probable inferences based on patterns it learned during training. Sometimes those patterns match your business reality. Sometimes they don’t.
The result is that familiar 80% accuracy ceiling. One in five customers gets flagged incorrectly—either false positives that waste your sales team’s time on healthy accounts, or false negatives that miss real churn risks until it’s too late.
Why Both Approaches Plateau at 80%
Whether you’re using vector search on documents for unstructured RAG, or SQL queries on databases for structured RAG, you inevitably hit the same ceiling: roughly 80% accuracy.
The root cause is fundamentally the same across both approaches. Traditional RAG treats information as disconnected fragments. Documents get broken into isolated chunks with no broader context. Database tables store isolated facts with no semantic meaning connecting them. LLMs receive these fragments and are forced to guess at the connections between them.
Both approaches are missing the same critical element: explicit semantic relationships.
What Makes Knowledge Graphs Different
Knowledge graphs take a fundamentally different approach. Instead of treating your data as disconnected chunks of text, they represent information as a network of explicitly defined relationships.
Think of it this way:
Traditional Database Thinking:
- Customer_ID: 45672
- Name: Acme Corp
- Revenue: $500K
- Status: Active
Knowledge Graph Thinking:
- Acme Corp is a Customer
- Acme Corp generated $500K Revenue
- $500K Revenue occurred in Q3 2024
- Acme Corp has relationship status Active
- Acme Corp purchased Product X
- Product X belongs to category Enterprise Software
See the difference? Every piece of information exists in context, with explicit connections to everything else.
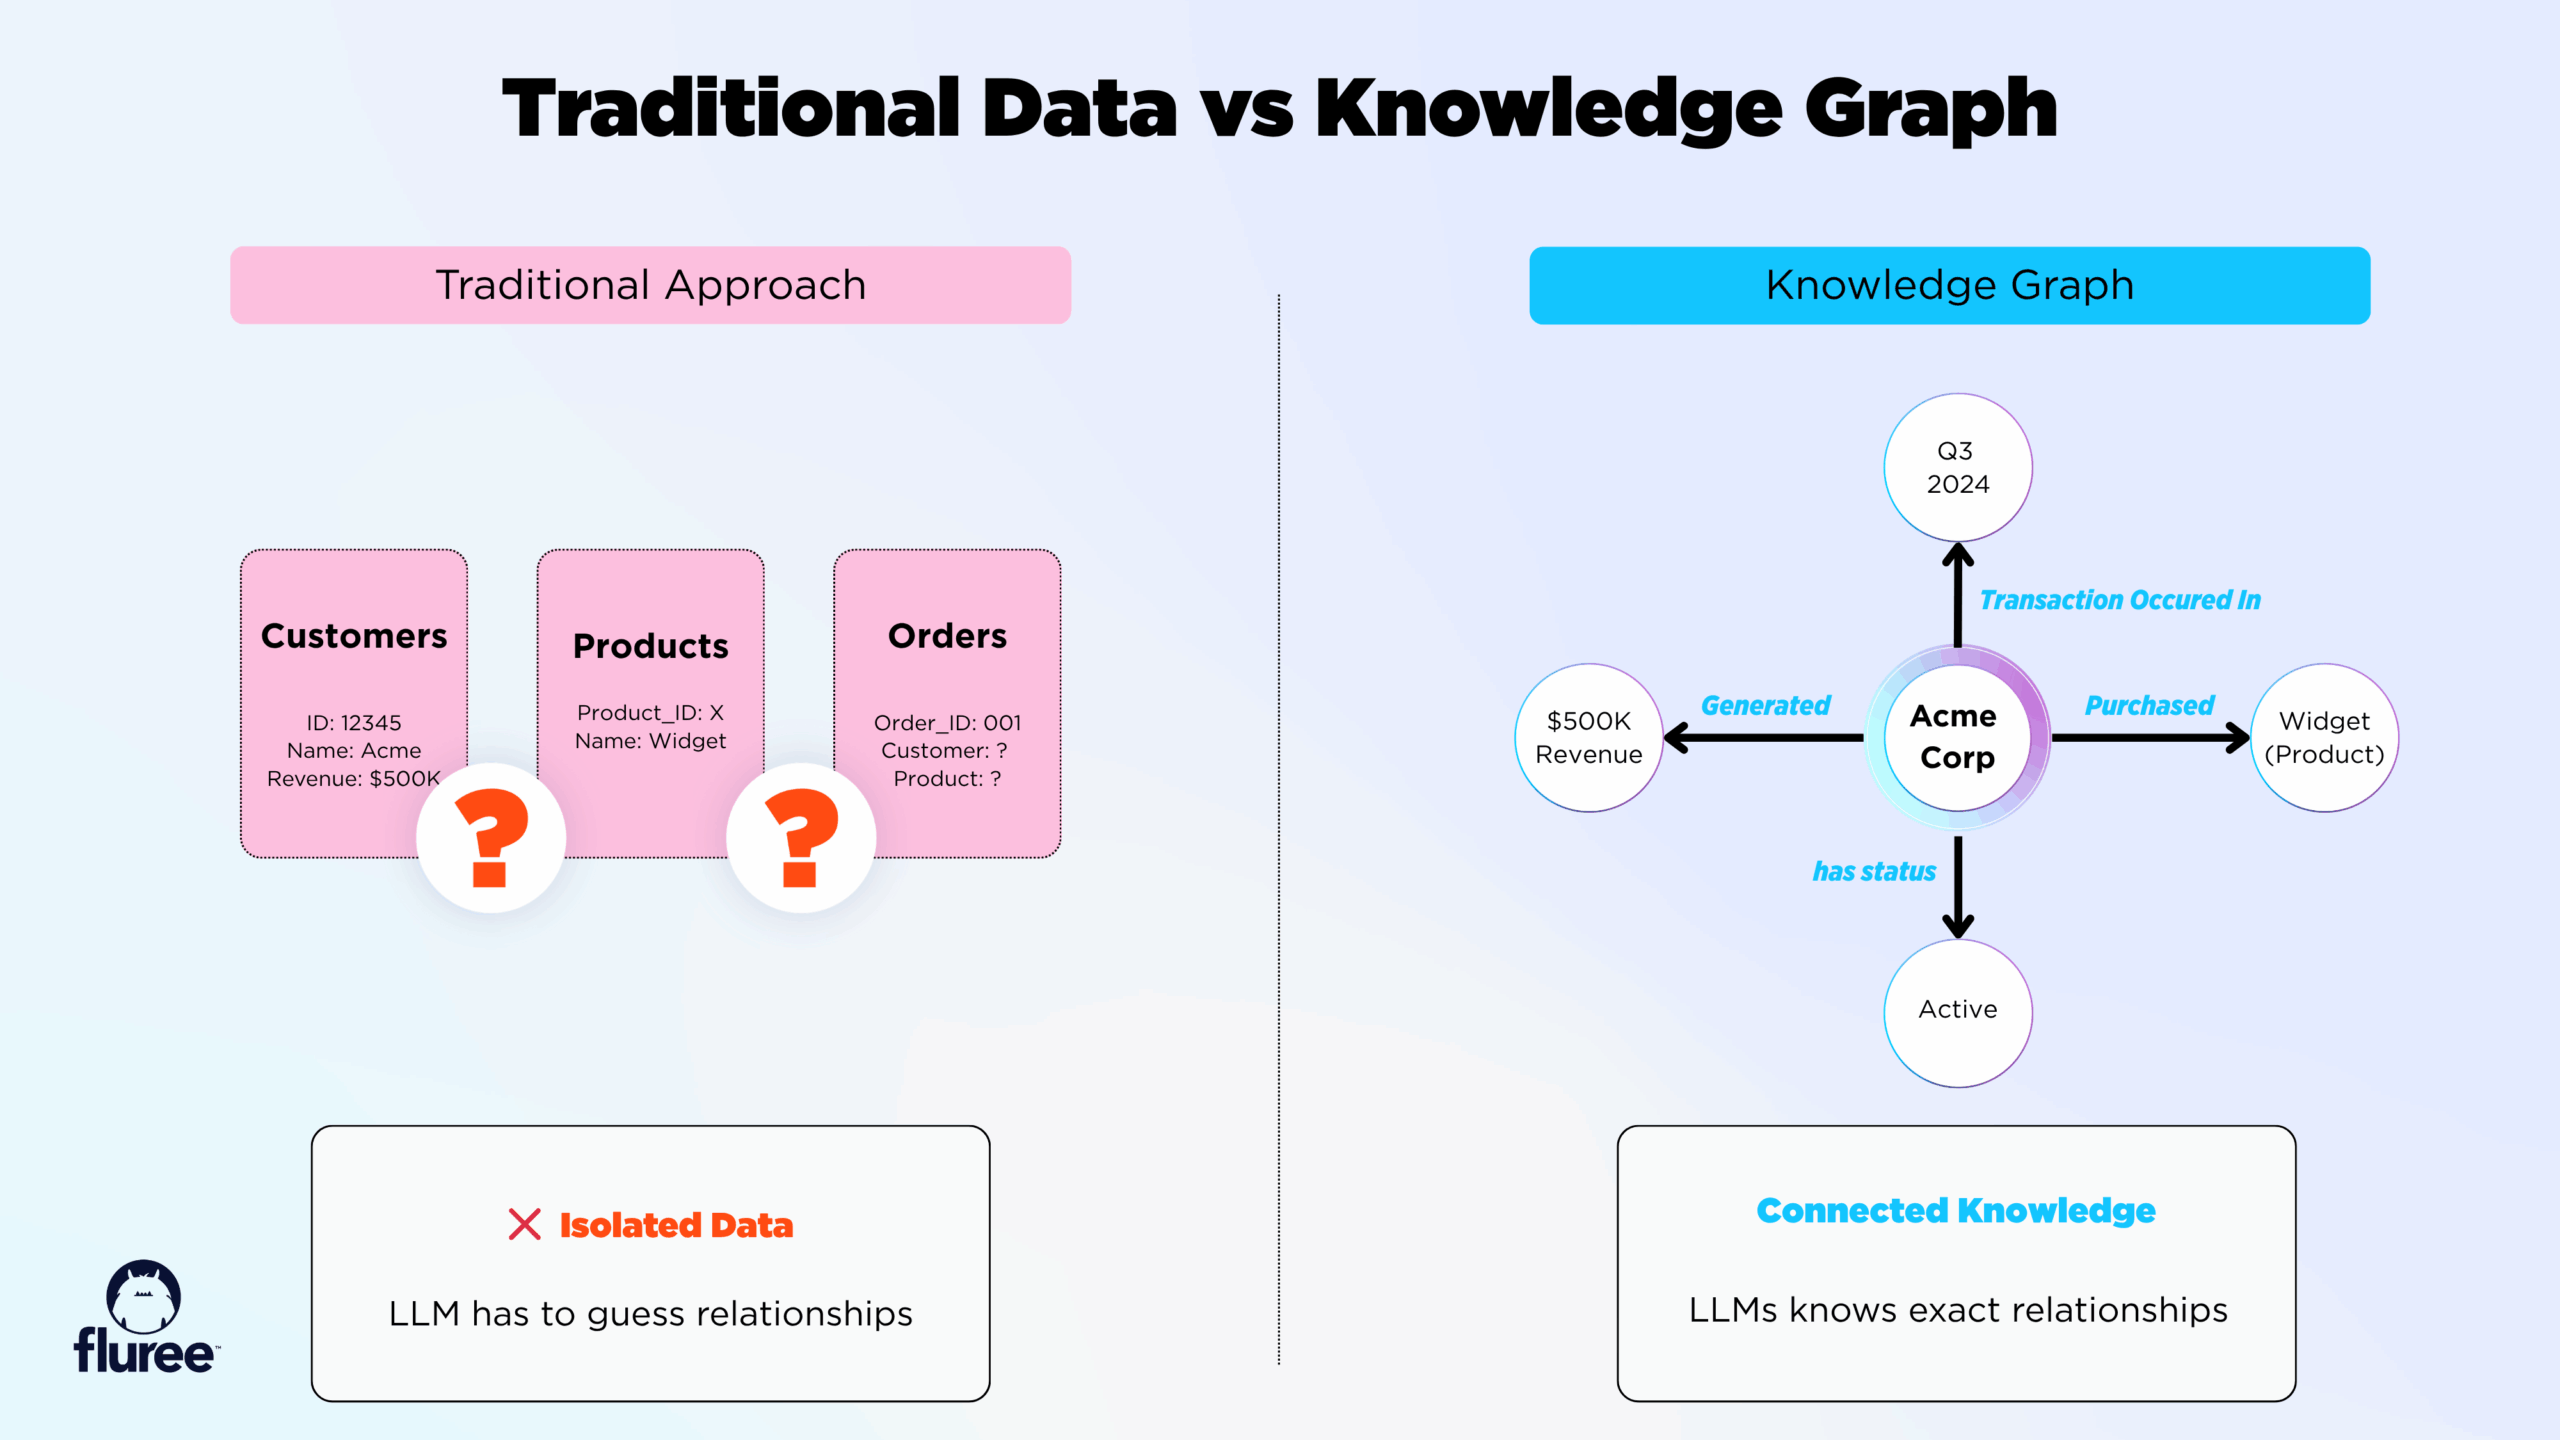
How traditional RAG and GraphRAG differ in processing enterprise data.
The Research: GraphRAG vs. Traditional RAG
Here’s where it gets really interesting. Fluree’s April 2024 study, GraphRAG for GenAI Accuracy, compared how LLMs perform when retrieving information from three different data sources:
- Centralized Relational Databases — your traditional SQL database
- Centralized Knowledge Graphs — semantic graph databases
- Decentralized Knowledge Graphs — distributed semantic graphs with embedded security
The methodology was straightforward: Give an LLM a series of 20 questions, starting simple and progressively getting harder. The questions required retrieving information from multiple systems—the kind of complex queries businesses ask every day.
The Results Were Dramatic
Source: Fluree, GraphRAG for GenAI Accuracy, April 2024.
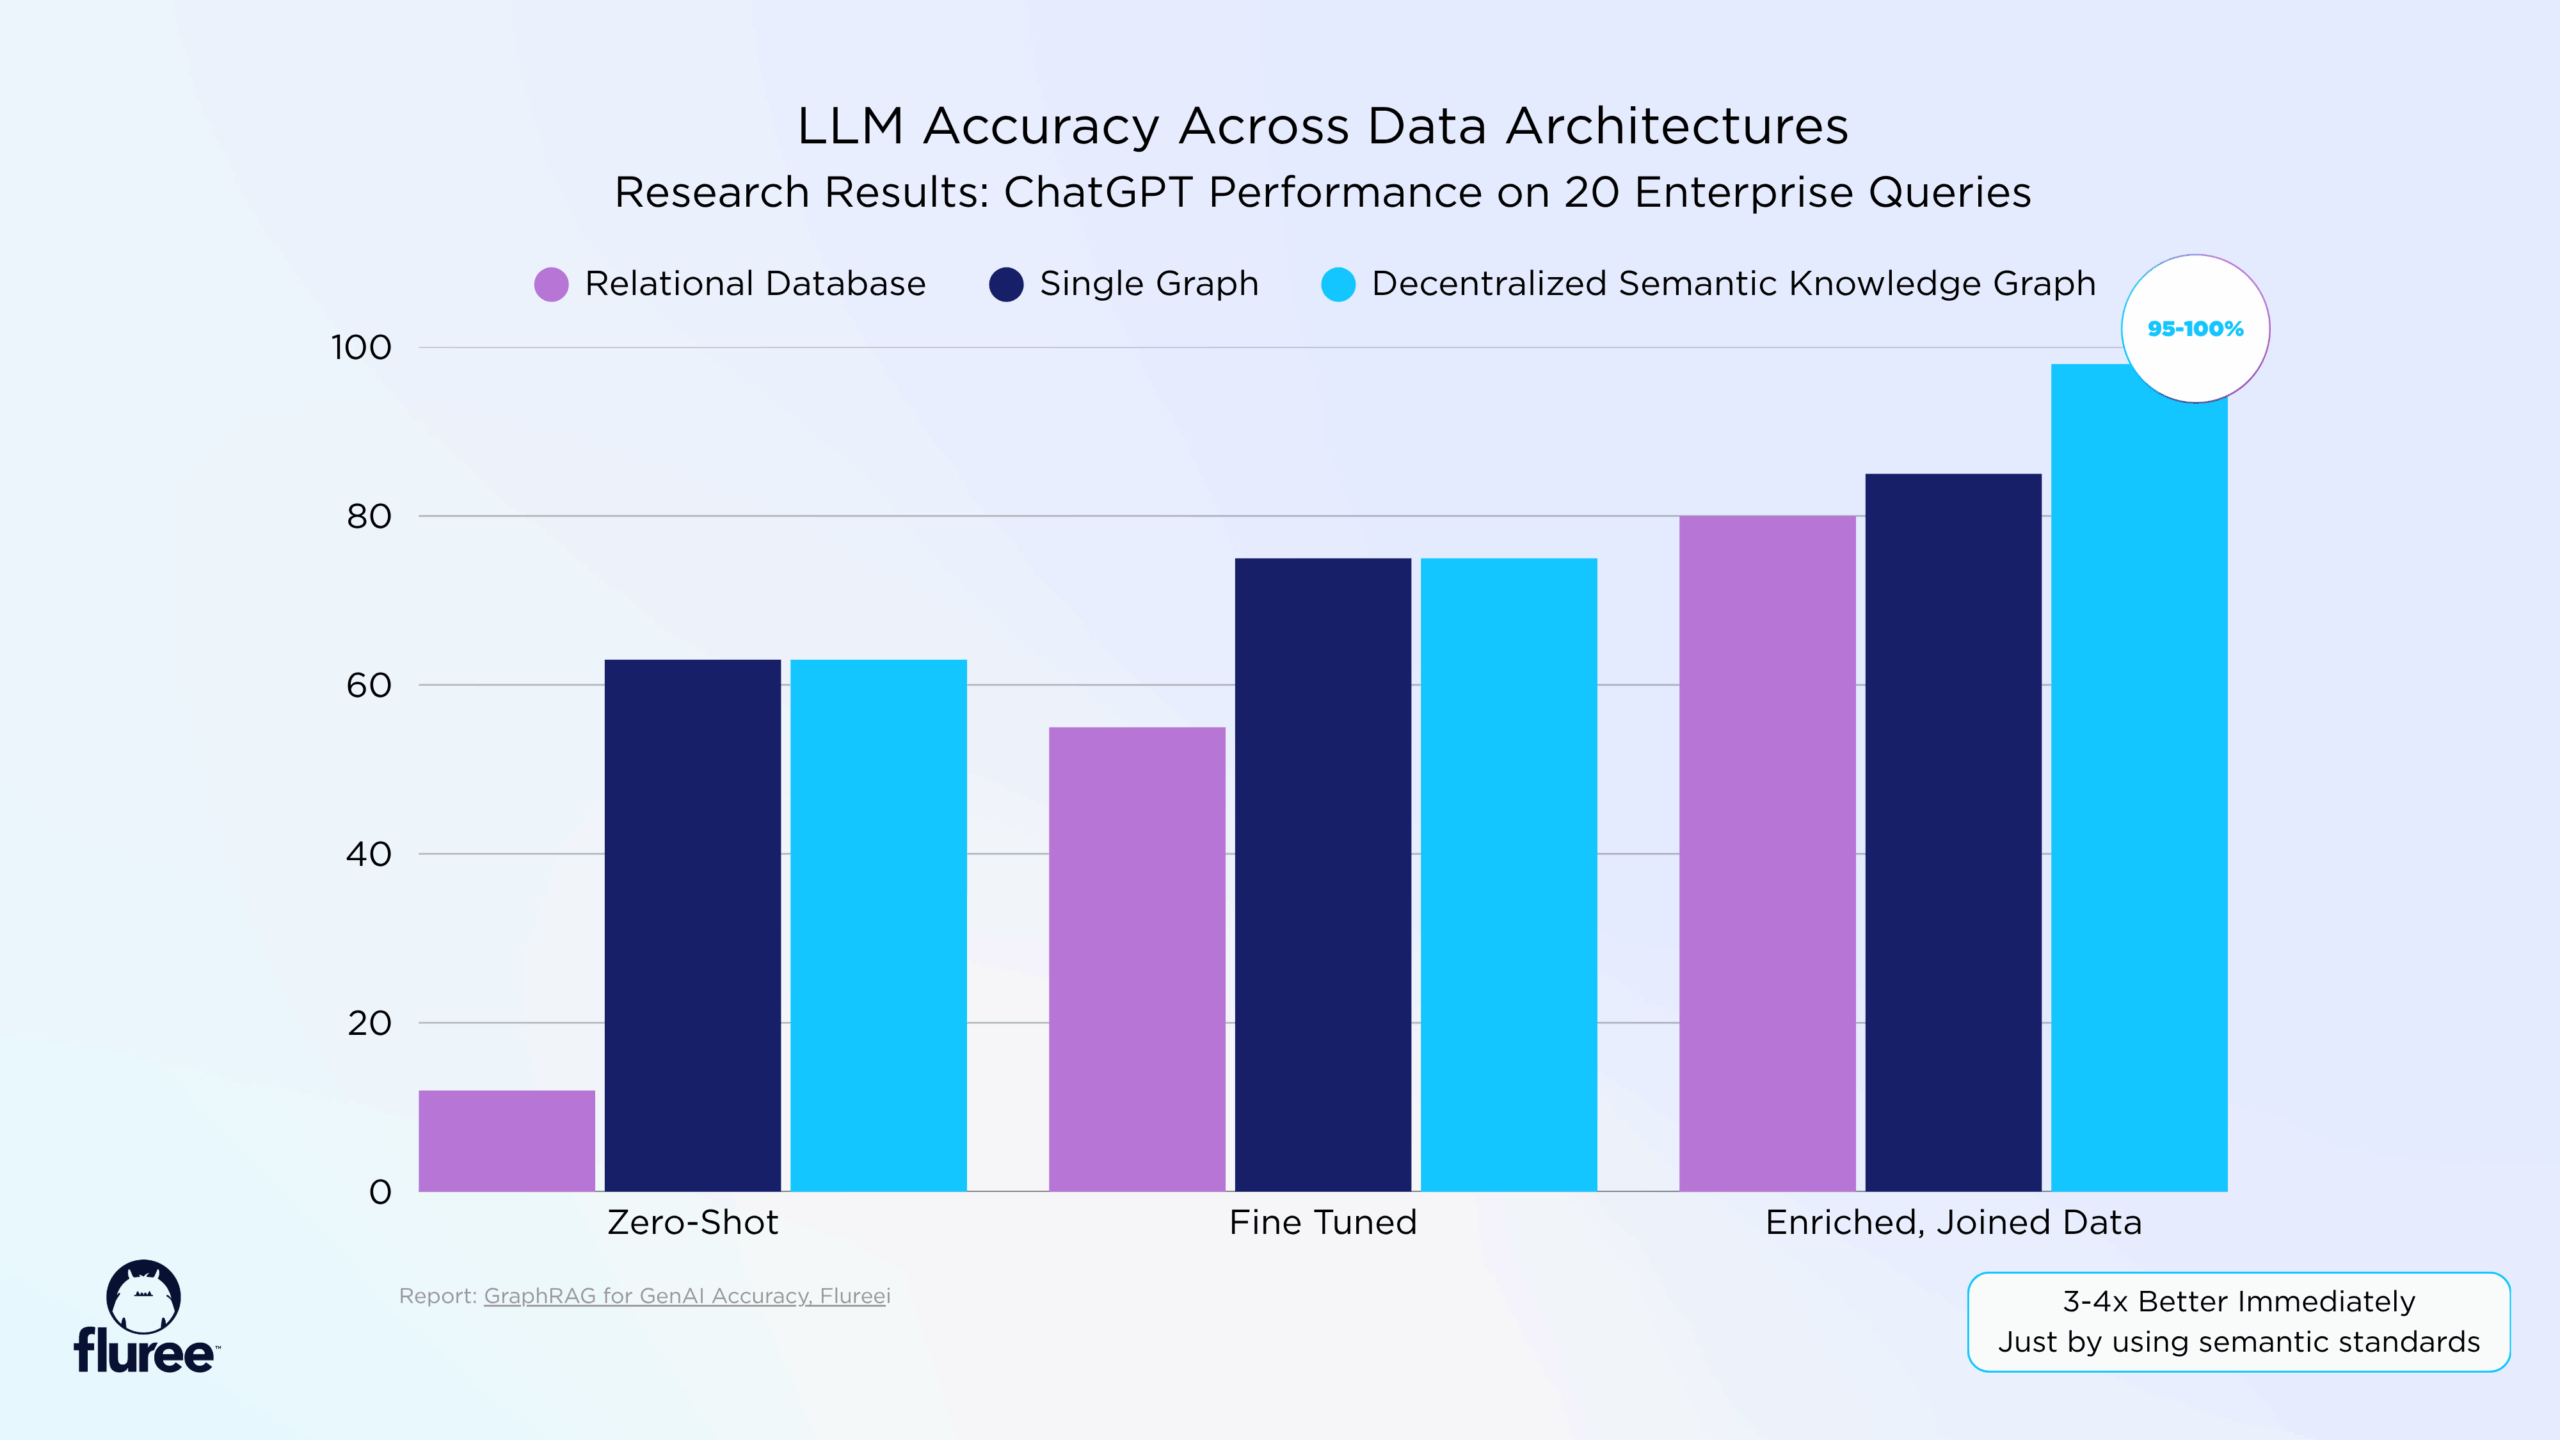
Accuracy benchmarks across three data architectures — decentralized knowledge graphs reach 90–99% once enriched. Source: Fluree, GraphRAG for GenAI Accuracy, April 2024.
Why Does GraphRAG Work So Much Better?
The secret lies in how LLMs actually process information. Here’s something fascinating: LLMs are themselves massive networks of statistical correlations. They understand relationships naturally because they are relationships.
When you give an LLM data structured as a knowledge graph using GraphRAG, you’re speaking its native language.
Semantic Understanding vs. Text Matching
Traditional RAG converts everything to numbers and matches similar numbers. GraphRAG uses semantic standards like RDF (Resource Description Framework) that explicitly define what things mean.
For example:
- Traditional RAG sees: "Apple reported earnings"
- GraphRAG knows: Apple [the company] reported [action] earnings [financial metric] on [specific date]
The difference? One is pattern matching. The other is understanding.
Explicit Relationships Prevent Confusion
Remember that revenue example earlier? Here’s how GraphRAG handles it differently:
Query: "How did Q3 revenue perform?"
Traditional RAG: Finds chunks mentioning "Q3" and "revenue," might return contradictory information.
GraphRAG issues actual queries to real data using explicit relationships:
- Traverses graph to find
Q3 2024 → Revenue → Actual Amount - Follows edges to
Q3 2024 → Revenue Target → Target Amount - Computes relationship
Actual vs. Target → 15% increase
Result: "Q3 revenue increased 15%, exceeding target"
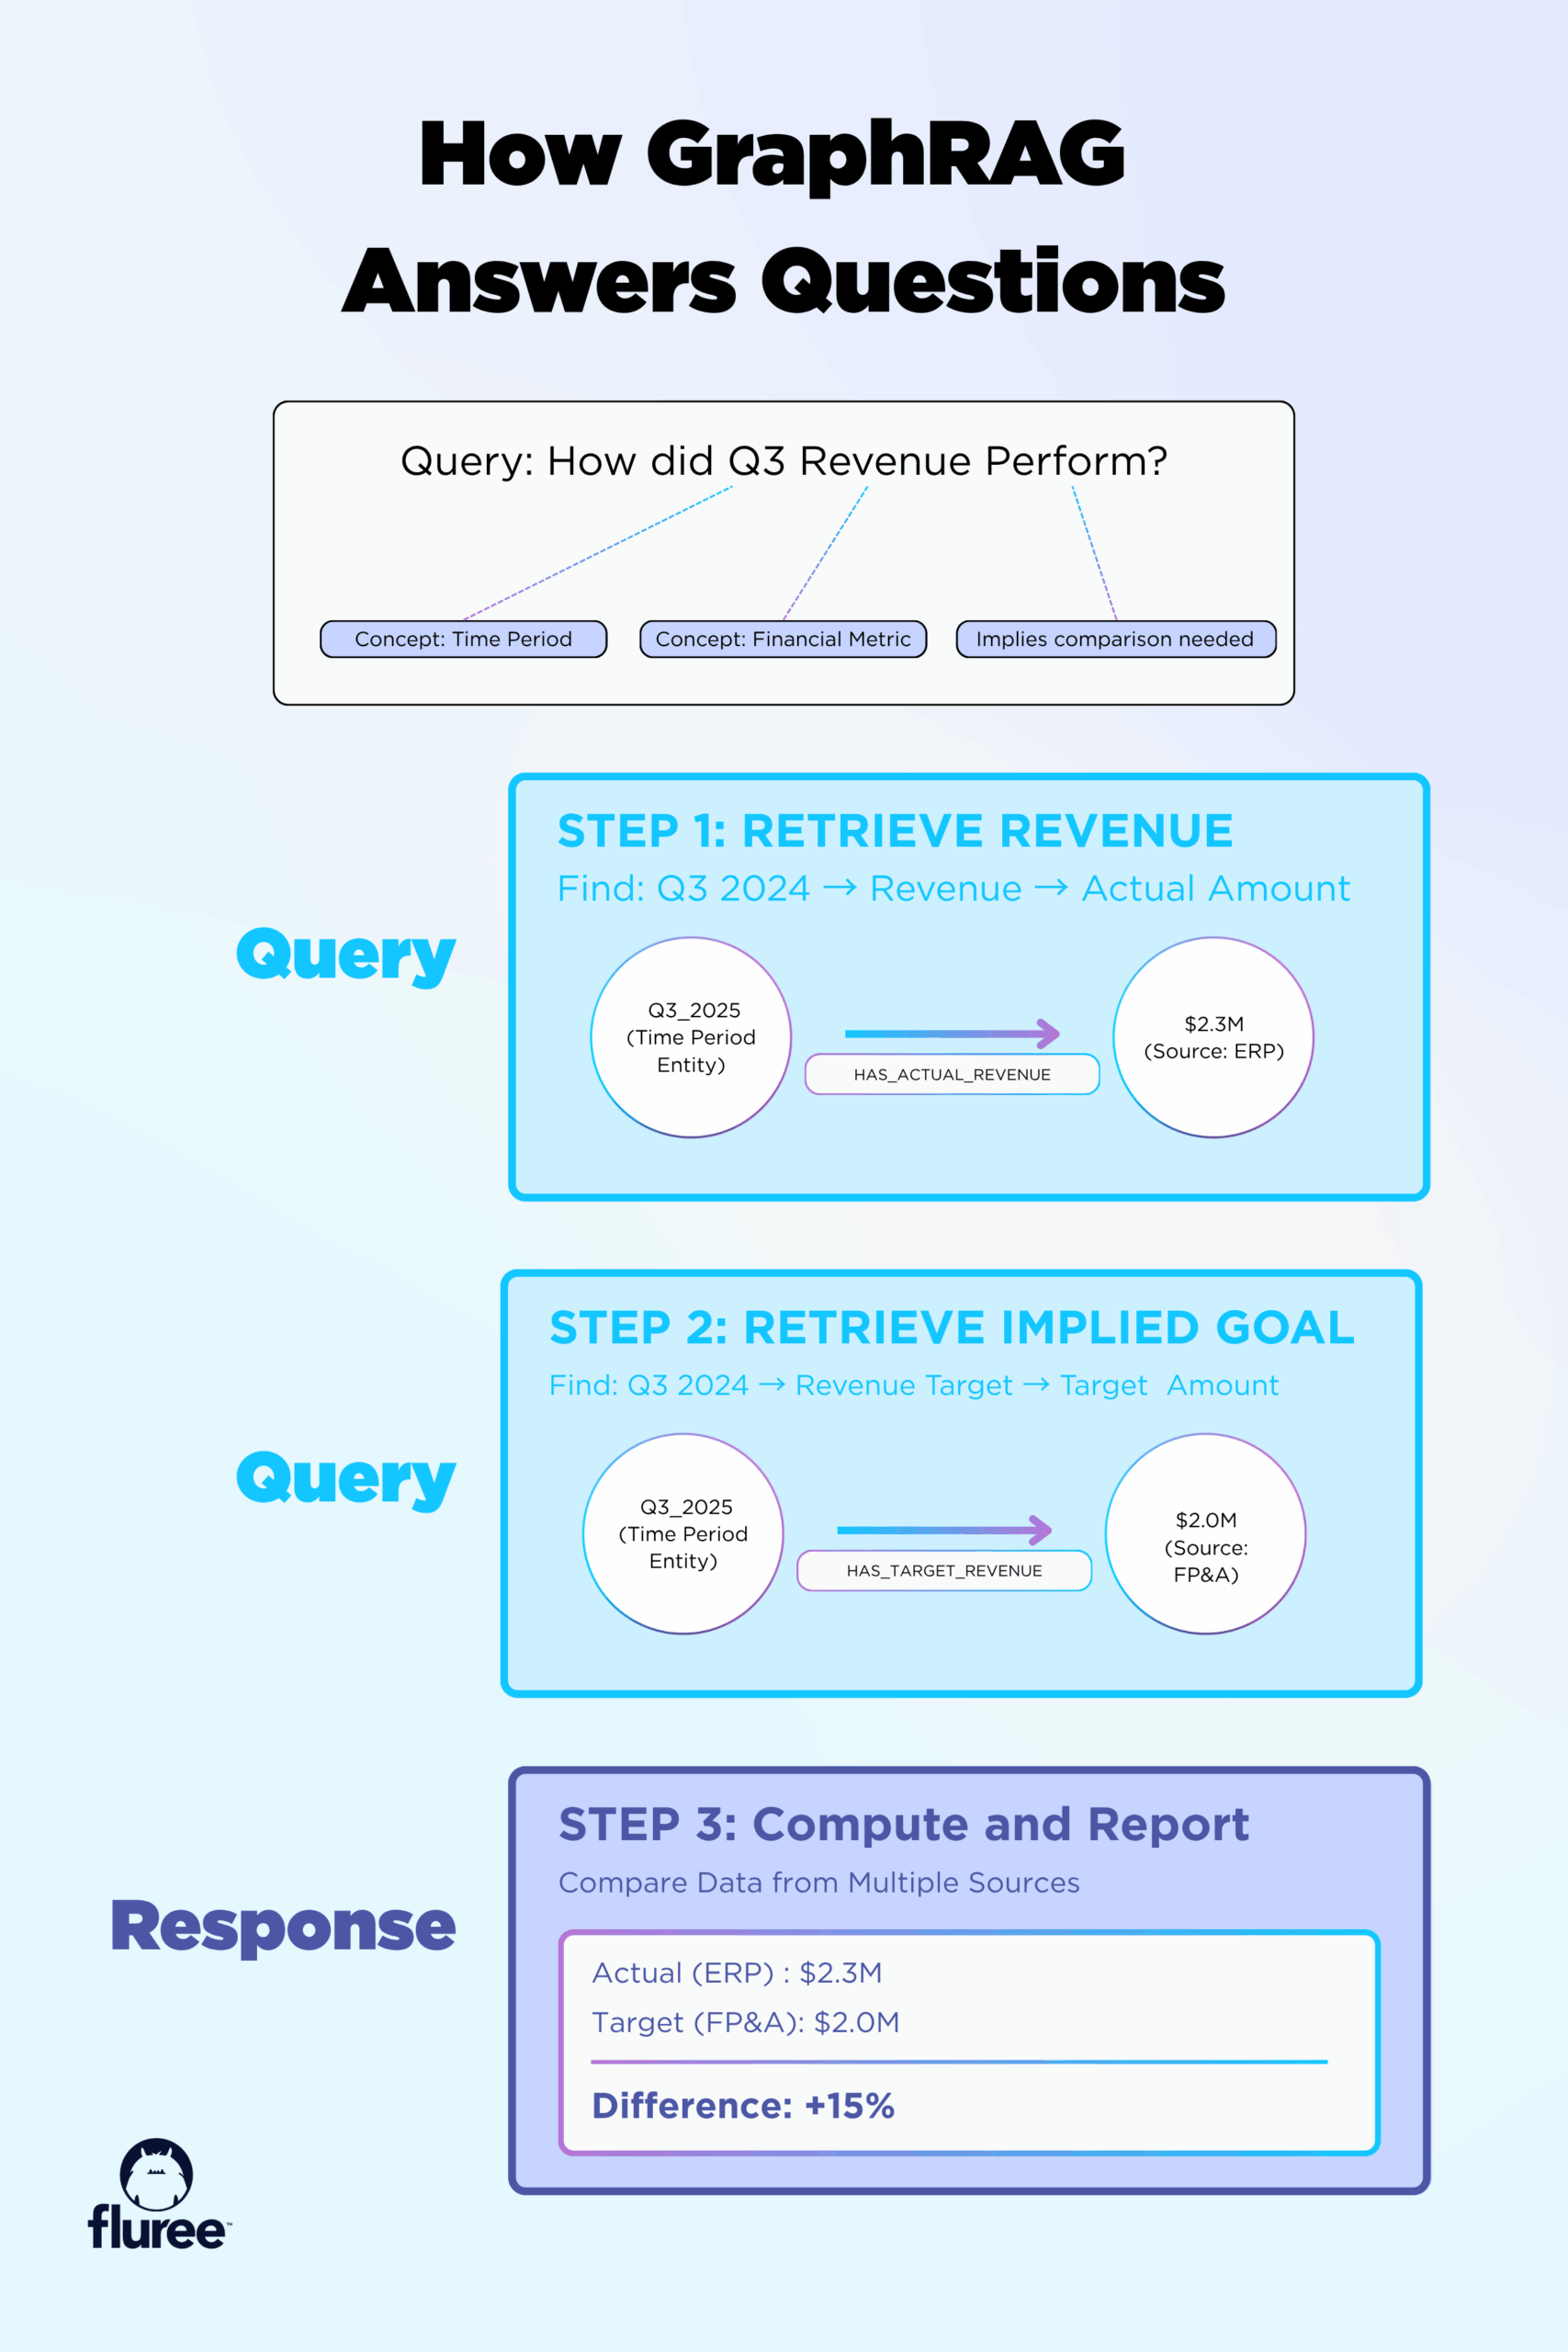
A GraphRAG query traverses explicit relationships instead of guessing from isolated chunks.
Ontologies Give LLMs a Map
Think of ontologies as a universal language for your business. Instead of having "customer" in your CRM, "client" in your ERP, and "account" in your billing system, an ontology defines that these are all the same concept: a Business Entity that Purchases Products.
When an LLM works with ontology-based data:
- It doesn’t have to guess if "customer" and "client" mean the same thing
- It understands that "generated revenue" and "purchased product" are related concepts
- It can reason about connections even when exact terminology differs
This provides a level of intelligence and understanding that traditional RAG just cannot achieve.
The Three Pillars of Enterprise-Ready GraphRAG
For GraphRAG to work in production environments—not just research labs—it needs three critical capabilities: universal connectivity into data sources, 100% verifiable answers, and embedded security.
1. Universal Connectivity
Your enterprise data lives everywhere:
- Legacy Oracle databases from the 1990s
- Modern cloud systems like Salesforce
- Unstructured PDFs and documents
- Real-time API feeds
- Audio recordings and transcripts
The Reality: Most organizations’ data is spread across many disconnected systems. Traditional RAG requires massive ETL projects to consolidate this data. By the time you finish integrating everything, the requirements have changed.
GraphRAG Solution: Connect to any source where it lives. Use semantic standards to create a unified view without physically moving data. When new sources emerge, connect them to the graph—no full reintegration required.
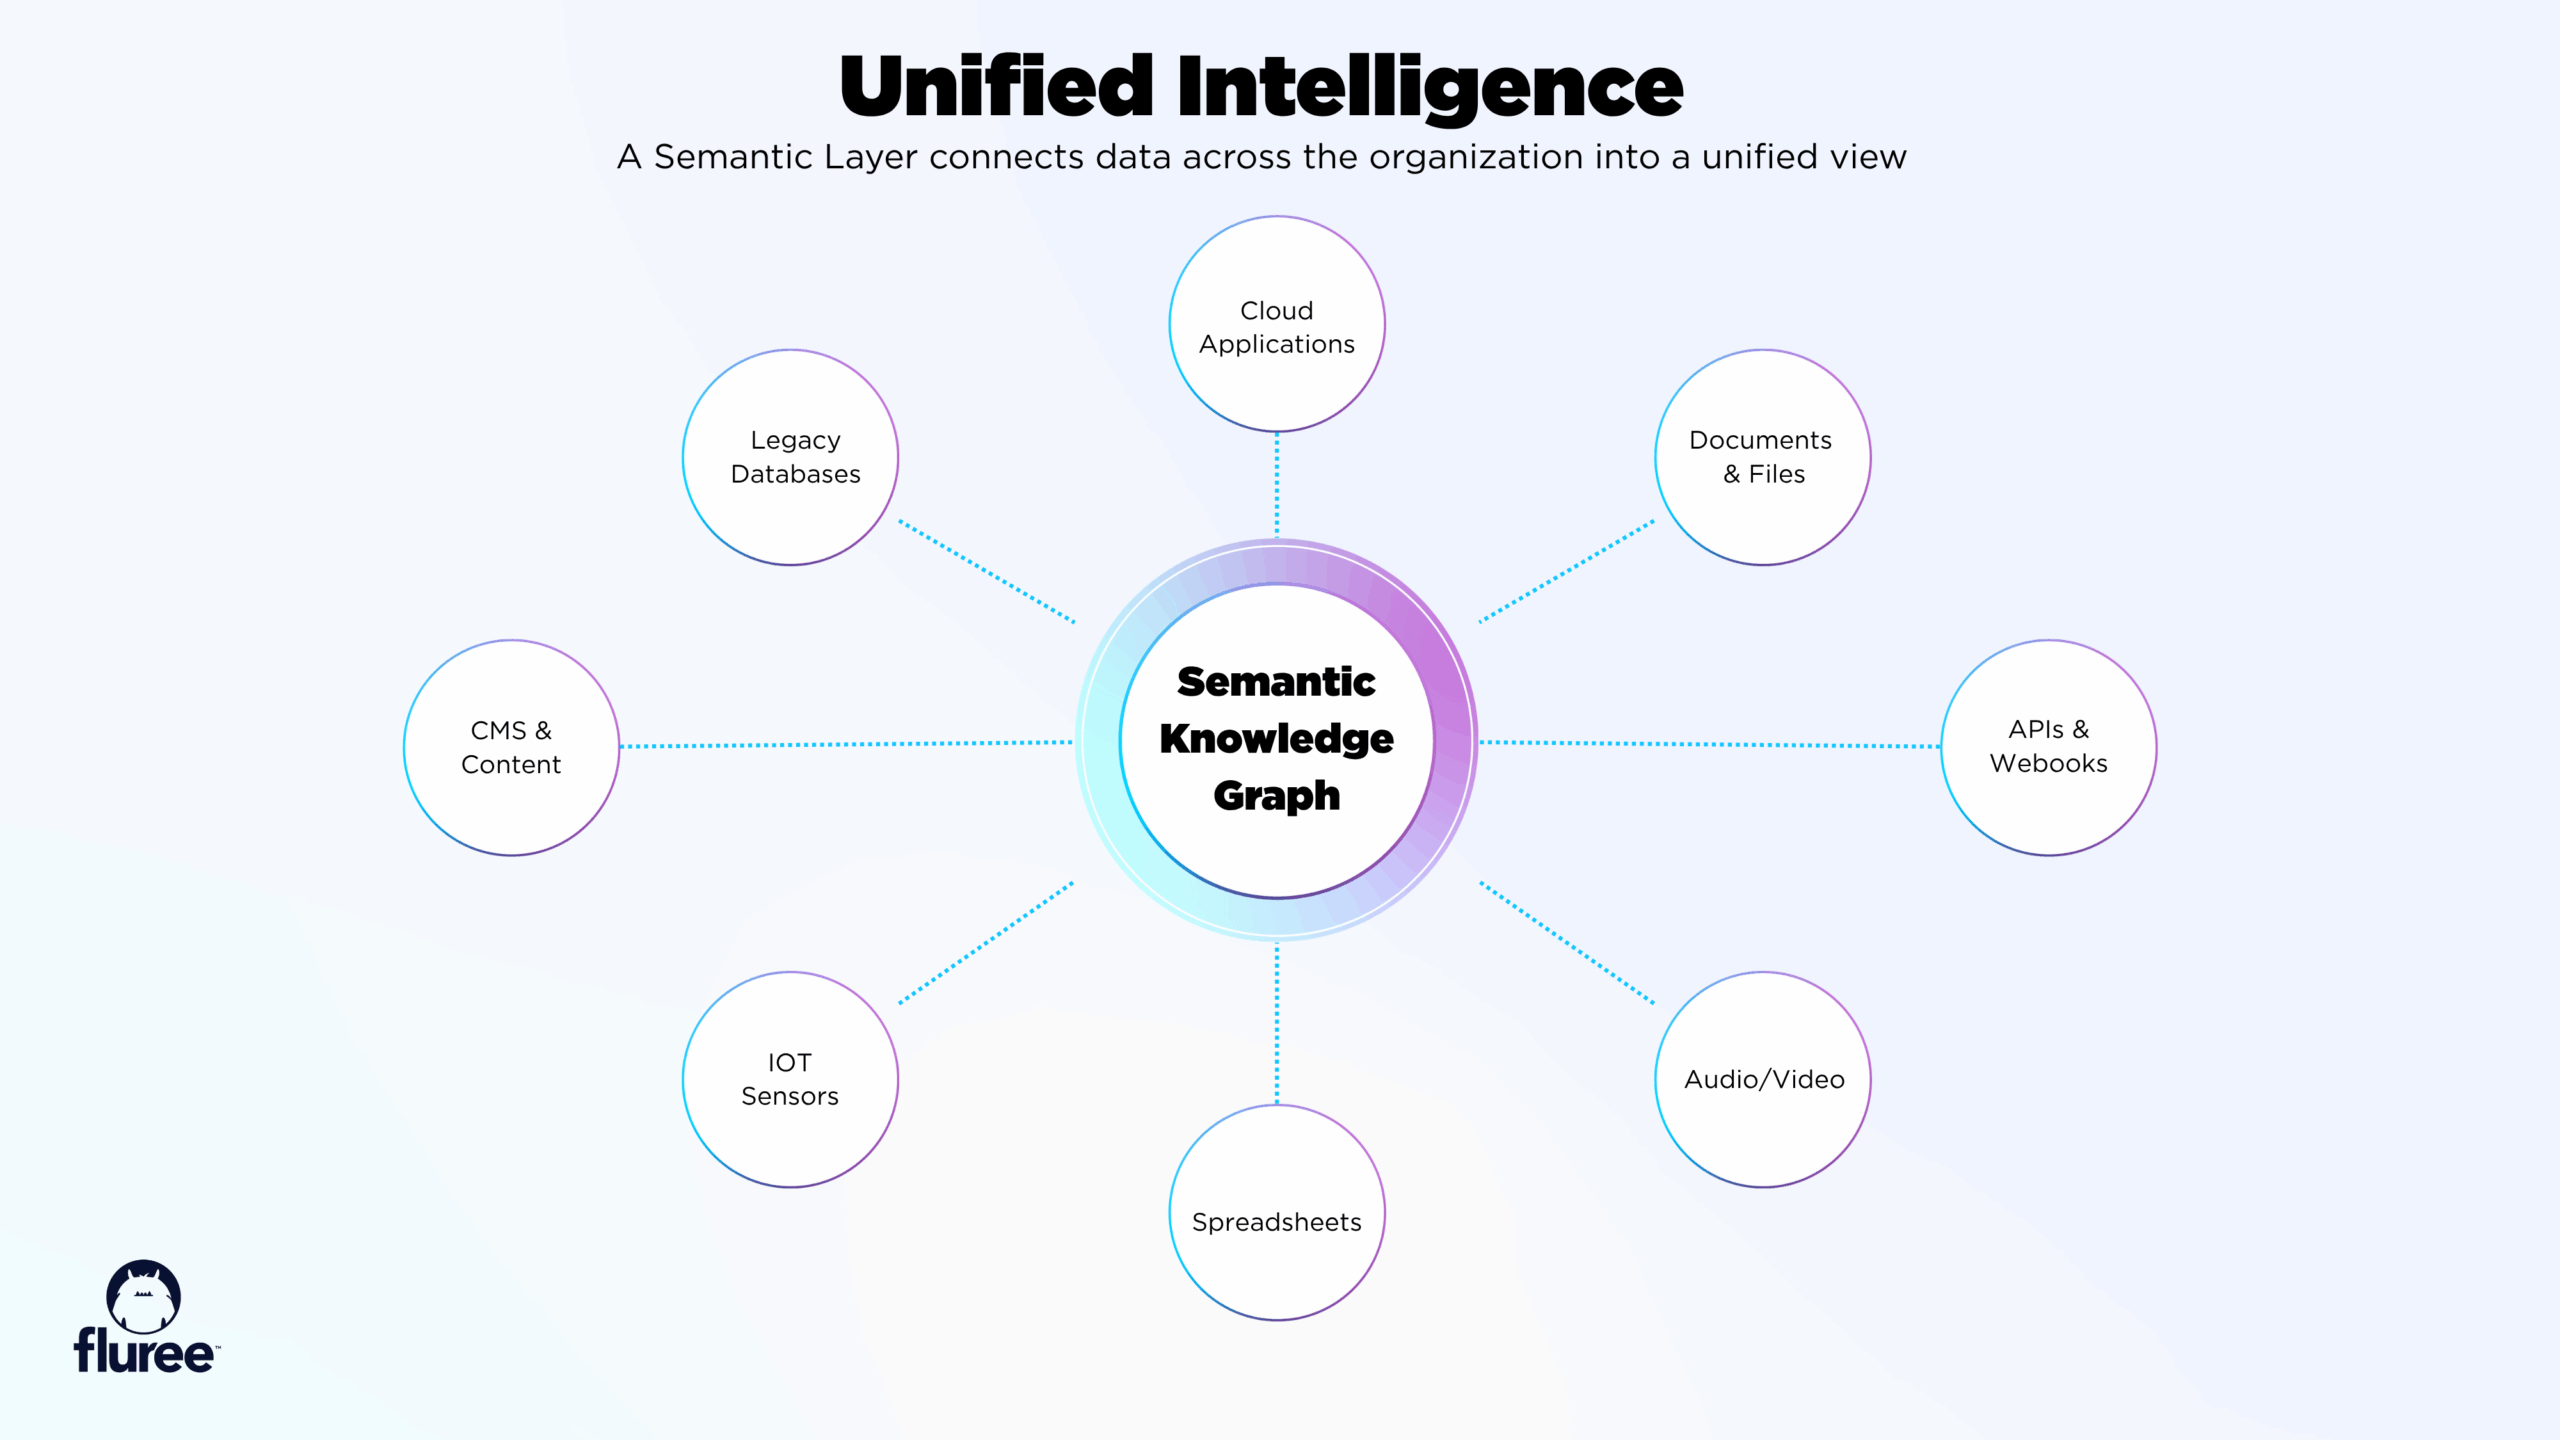
Universal connectivity lets the graph reach every system without physically moving the data.
2. 100% Verifiable Answers
Here’s what separates real enterprise AI from chatbots: Every answer must be traceable to its source.
In regulated industries—healthcare, finance, legal—you can’t act on information you can’t verify. "The AI said so" isn’t acceptable when auditors come knocking.
GraphRAG provides complete lineage:
- Which data sources were queried
- Which specific records were retrieved
- What relationships were traversed
- When the data was last updated
- Who has authority over that data
When an LLM tells you a patient is allergic to penicillin, you need to know that it came from their verified medical record, not from a pattern match on similar patient names.
3. Embedded Security and Governance
Traditional RAG has a dangerous assumption: If you can ask a question, you can see all the data needed to answer it.
This creates two terrible options:
- Option A: Lock down data access so tightly that the AI can’t answer useful questions
- Option B: Grant broad access and hope nothing sensitive leaks
Fluree offers a third way: Embed security and governance rules directly into the data graph.
Example: An HR manager asks, "What’s the average salary in the engineering department?"
Traditional RAG: Retrieves all salary data, returns answer, potentially exposes individual salaries.
Fluree GraphRAG with embedded policy:
- Query reaches salary data nodes
- Data policy checks: "Does requester have right to see individual salaries?"
- Policy responds: "No, but they can see aggregates"
- Graph returns: Average calculated, no individual data exposed
- LLM receives: Aggregate number only
- Answer: "Average engineering salary is $145K" (individual salaries never seen by LLM or user)
The privacy protection happens at the data level, not the application level. The LLM itself never sees data it shouldn’t—even in its context.
Real-World Impact: What 95%+ Accuracy Actually Means
Let’s make this concrete. Here’s what happens when you move from 80% accuracy to over 95% accuracy:
At 80% accuracy (1 in 5 answers wrong):
At 95%+ accuracy (at least 19 in 20 answers correct):
That extra 15% is the difference between "interesting experiment" and "business transformation."
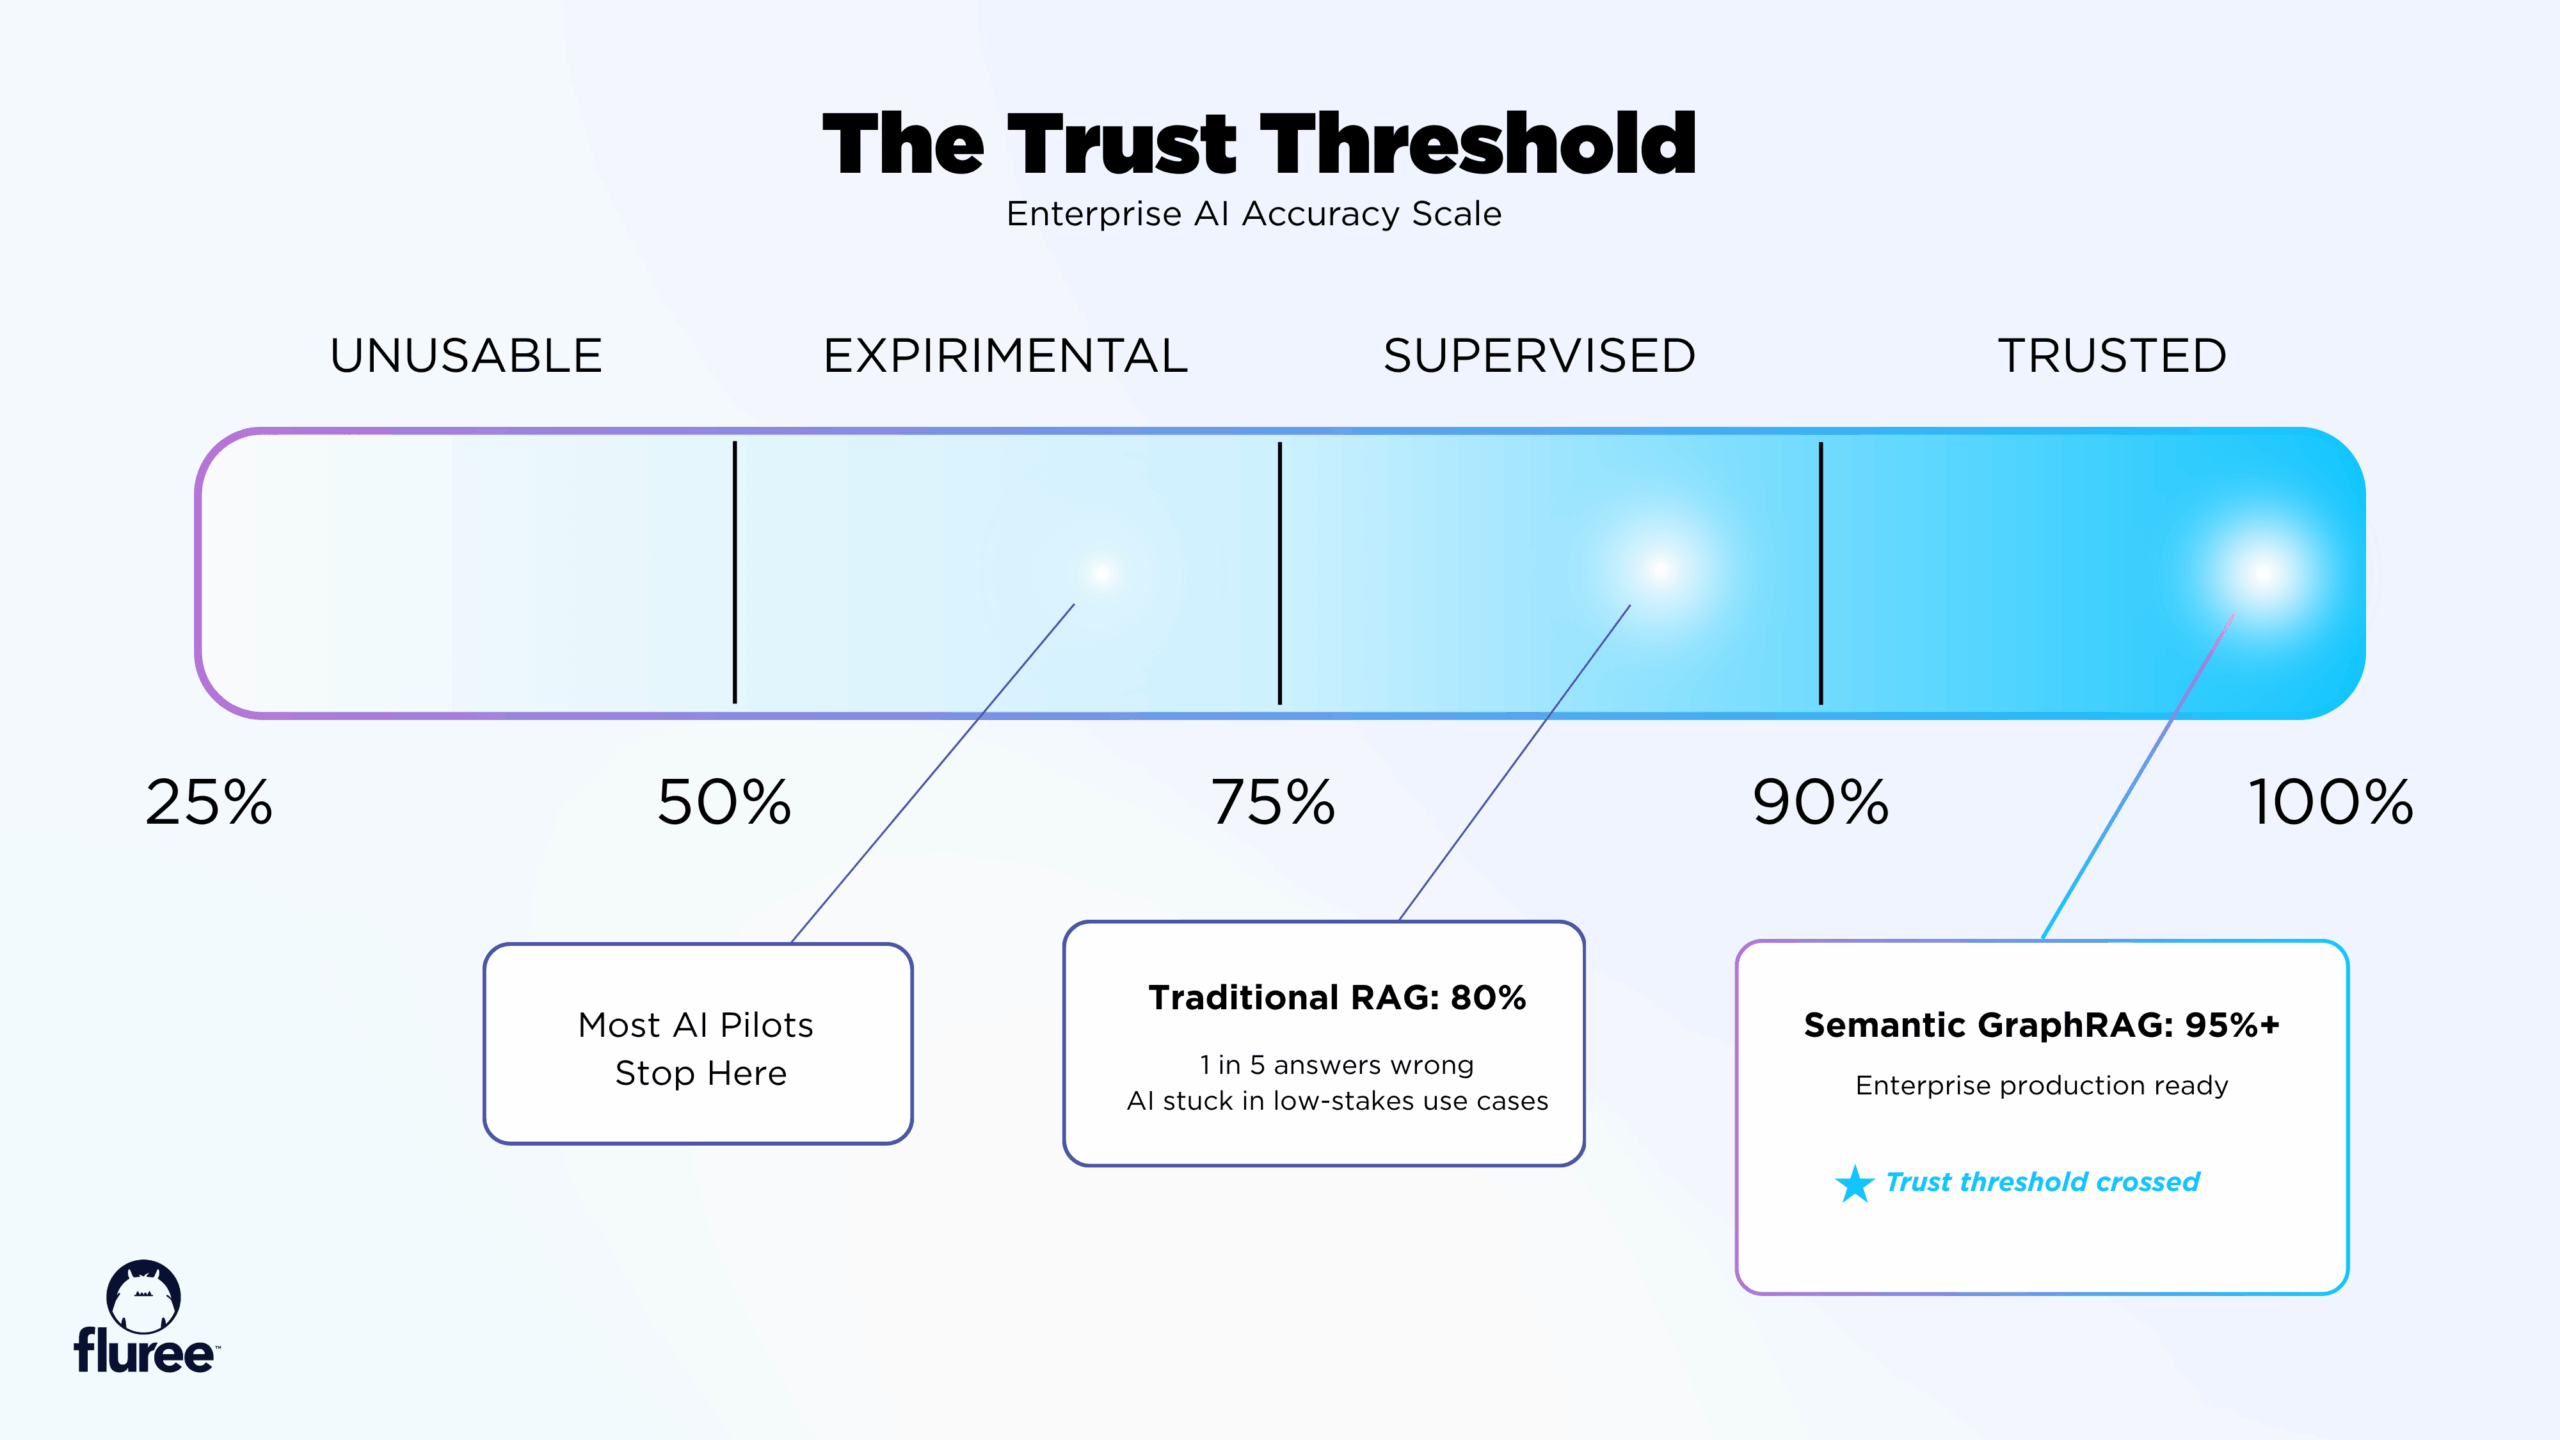
The jump from 80% to 95%+ accuracy is where AI becomes a trusted partner in critical workflows.
The Hidden Advantage: LLMs Already Understand Graphs
Here’s a fascinating discovery from Fluree’s April 2024 study: When you express database schemas as semantic ontologies (using RDF instead of SQL DDL) and ask ChatGPT to generate queries, accuracy jumps 3x immediately—without any training.
Why? Because LLMs were trained on massive amounts of linked data, semantic web standards, and graph-structured information. When you give an LLM data in semantic format, you’re working with its training, not against it.
Even more interesting: ChatGPT and Claude already know how to convert SQL schemas into semantic ontologies. This means the barrier to entry is lower than most organizations think.
You don’t need to rebuild your entire data infrastructure. You can start by creating semantic views over existing systems, letting the graph layer handle translation.
What About Decentralized Knowledge Graphs?
Fluree’s study showed that decentralized knowledge graphs achieved the highest accuracy (90–99%). But what does "decentralized" actually mean, and why does it matter?
The Centralization Problem
Traditional enterprise data warehouses promise "single source of truth." But in reality, centralizing all your data is:
The Decentralized Approach
Decentralized knowledge graphs flip the model:
Real-world example: Your sales team in Germany needs to answer: "Which US customers have similar profiles to our most profitable EU customers?"
Traditional approach: Move customer data from US to EU (GDPR violation), or vice versa (expensive), or give up on the question.
Decentralized GraphRAG:
- EU graph contains EU customer data (stays in EU)
- US graph contains US customer data (stays in US)
- Query traverses both graphs based on semantic relationships
- Aggregated insights returned (no individual PII crosses borders)
- Full compliance maintained
Implementing GraphRAG: What It Takes
If you’re thinking, "This sounds great, but isn’t building a knowledge graph impossibly complex?" let’s address that directly.
Common Misconceptions
The Practical Path Forward
Phase 1: Prove the Concept (2-4 weeks)
Phase 2: Expand Coverage (2-3 months)
Phase 3: Scale Enterprise-Wide (6-12 months)
The Economic Case: Why Accuracy Matters More Than You Think
Let’s talk about ROI. If you’re evaluating GraphRAG, someone will ask: "Is the accuracy improvement worth the investment?"
Here’s a framework for thinking about it. The dollar figures below are illustrative orders of magnitude, not benchmarks — substitute your own numbers:
The Cost of Hallucinations
Low-stakes hallucinations:
- User asks question, gets wrong answer, asks again
- Cost: User frustration, reduced AI adoption
- Annual impact: Hundreds of wasted hours, maybe $50-100K in lost productivity
Medium-stakes hallucinations:
- Sales team pursues wrong leads based on flawed insights
- Marketing spends budget on wrong customer segments
- Annual impact: Hundreds of thousands in misdirected effort
High-stakes hallucinations:
- CFO makes strategic decision based on incorrect financial data
- Compliance team misses regulatory requirement
- Healthcare provider acts on wrong patient information
- Annual impact: Millions in losses, legal liability, reputation damage
The Value of 95% Accuracy
When your AI is accurate enough to trust with critical decisions:
- Executives use it for board presentations (saves $200K+ in analyst time)
- Compliance runs on it (saves $500K+ in manual audit work)
- Real-time decision making (captures opportunities worth millions)
- Customer experience improvements (retention, satisfaction, NPS gains)
- Reduced risk of catastrophic errors (incalculable value)
For most enterprises, the ROI case isn’t marginal—it’s overwhelming.
Security and Privacy in GraphRAG
We touched on embedded security earlier, but this deserves deeper attention because it’s often the dealbreaker for enterprise AI adoption.
The Traditional RAG Security Problem
When an LLM needs to answer a question, traditional RAG faces a dilemma:
- Retrieve broad data to ensure completeness
- Filter sensitive data before handing it to the LLM
- Hope you caught everything that shouldn’t be exposed
This approach has three failures:
Failure #1: Over-retrieval. You retrieve more data than needed, expanding attack surface. Even if you filter before the LLM sees it, that data moved through your system.
Failure #2: Context leakage. LLMs need context to answer well. If you strip too much sensitive data, answers become useless. If you leave it in, you risk exposure.
Failure #3: Audit trail gaps. When things go wrong, can you prove what data the LLM actually saw? Often, no.
How Fluree GraphRAG Embeds Security
In Fluree, security works differently:
1. Policy lives with the data
Each node in the graph carries its own access policy:
- "Only HR directors can see individual salaries"
- "Only users in EU can access EU resident data"
- "Aggregate views allowed, individual records require approval"
2. Query-time enforcement
When an LLM queries the graph:
- Graph evaluates: "Who is asking?"
- Graph checks: "What are they authorized to see?"
- Graph returns: Only data that passes policy
- LLM never sees what it shouldn’t
3. Complete lineage
Every query is logged:
- Who asked
- What they accessed
- What policy was applied
- When it happened
- Full audit trail
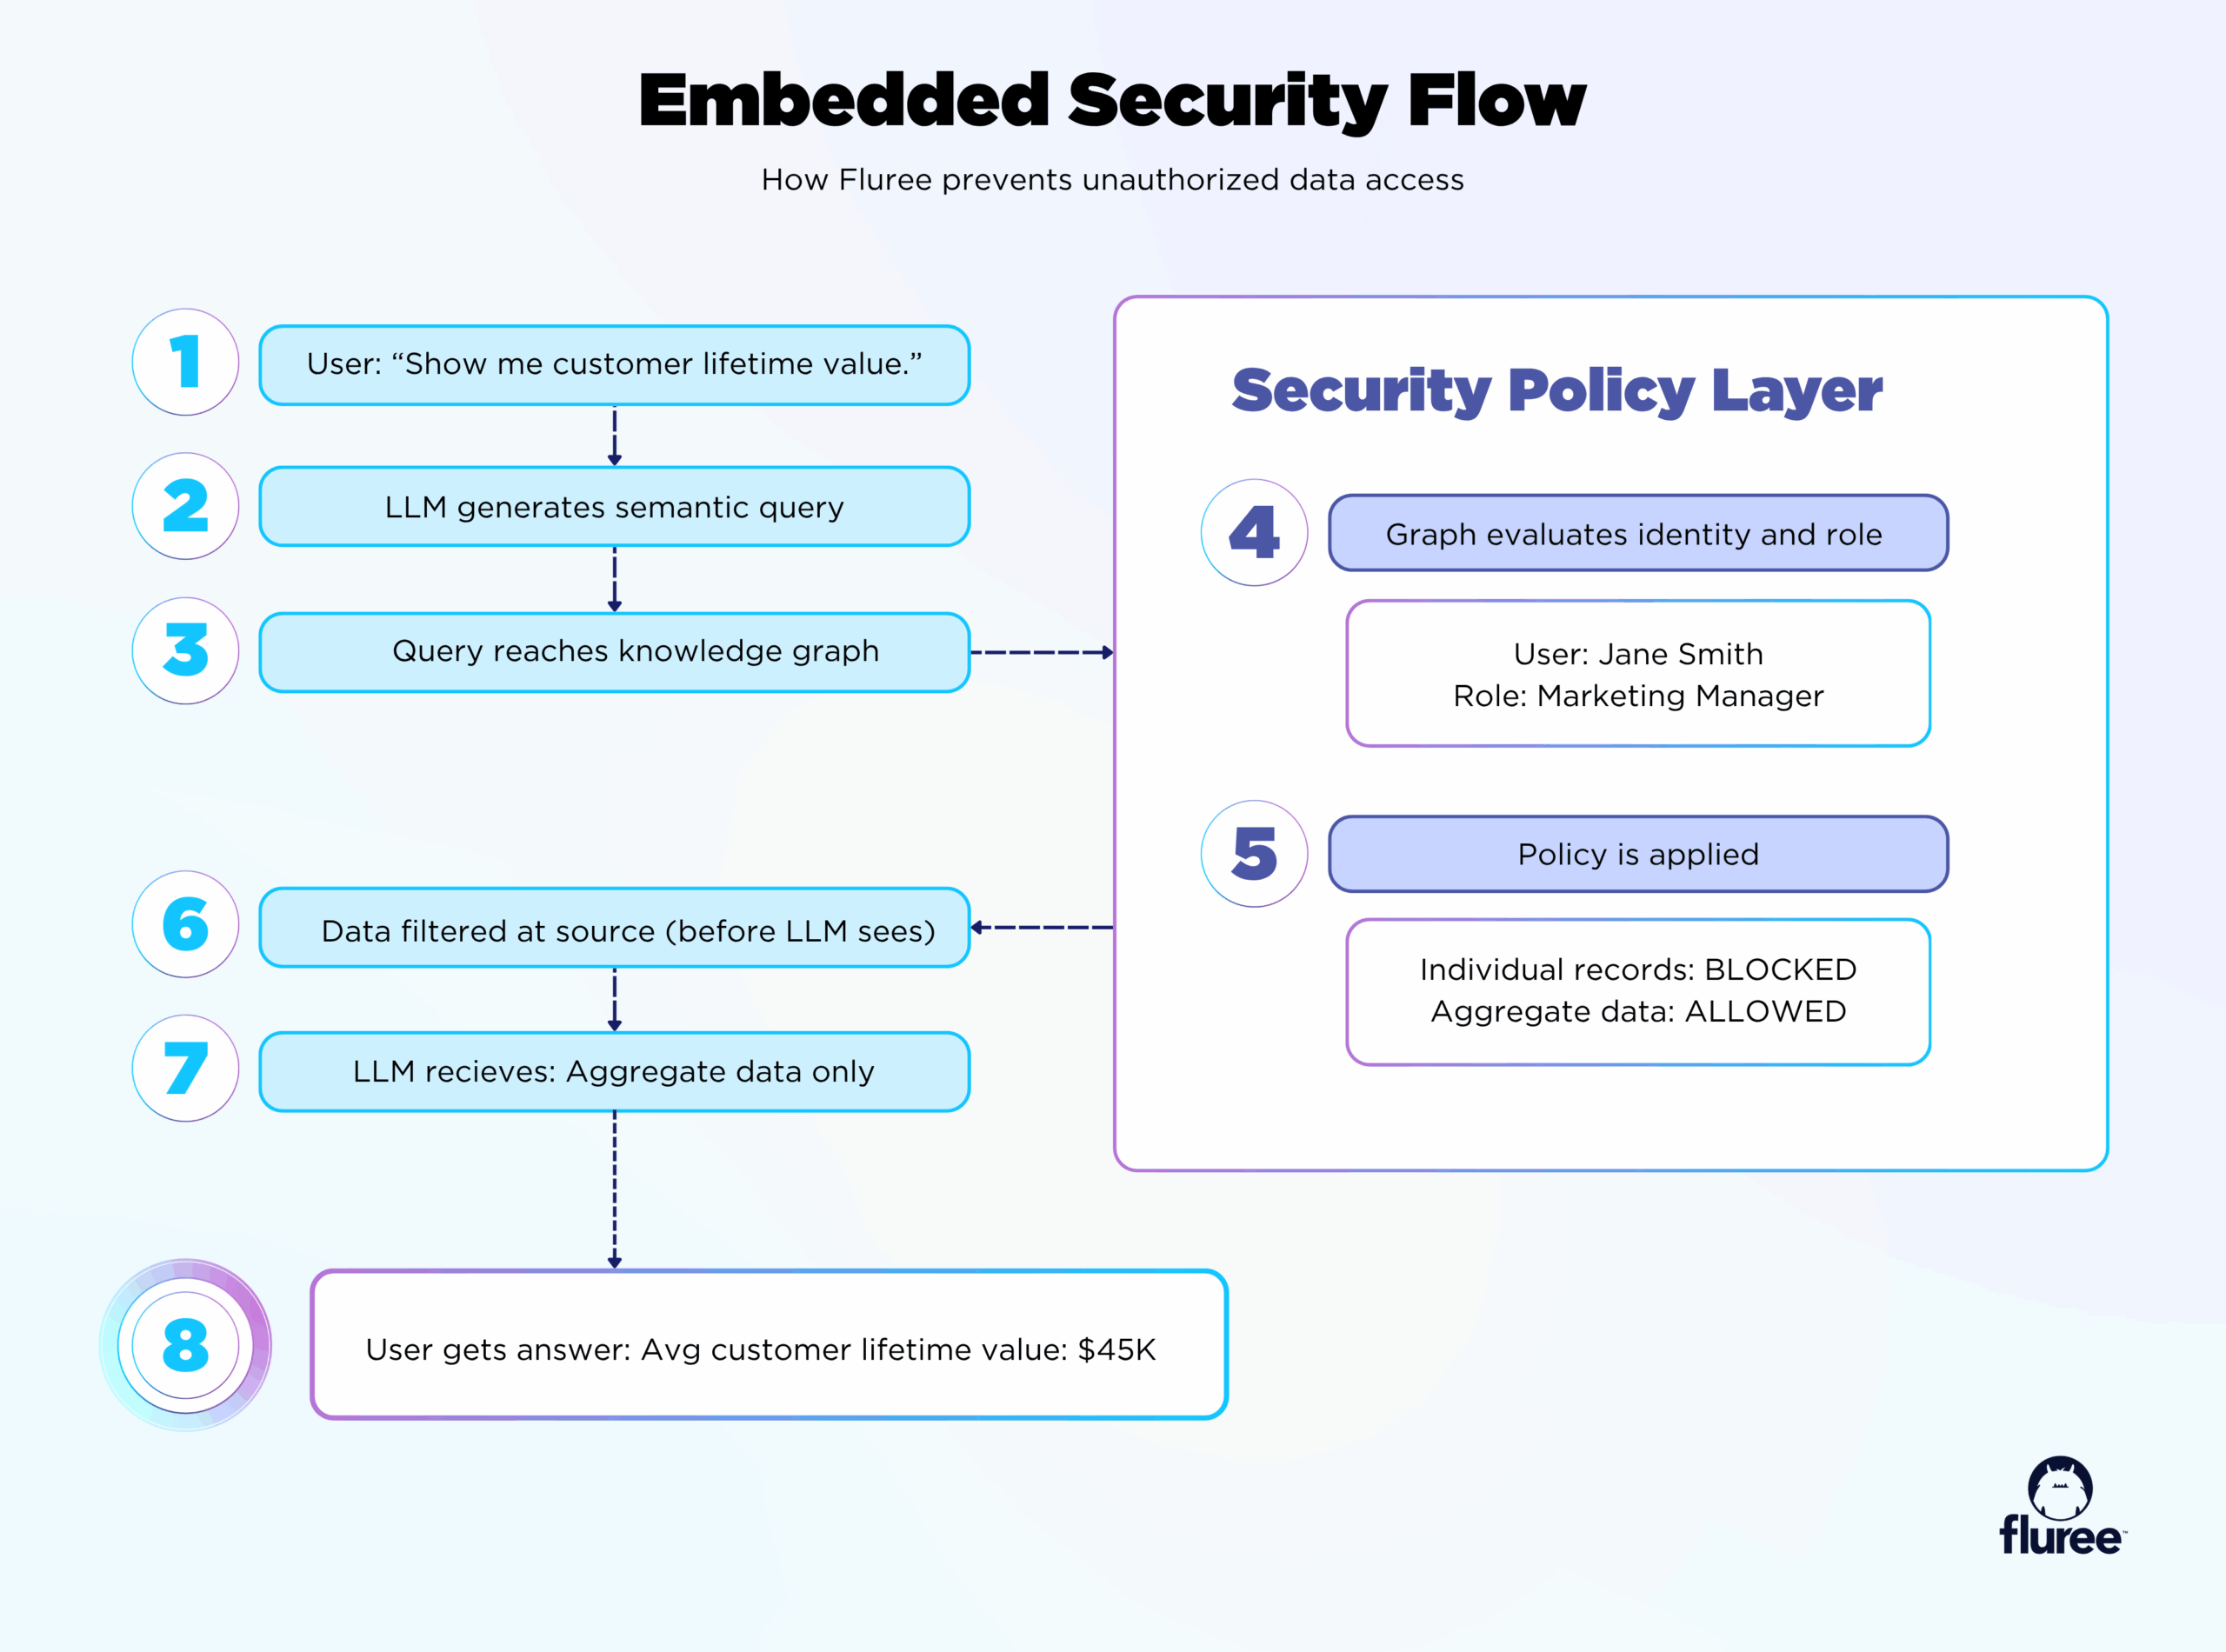
Security lives with the data, not the application — so the LLM never sees what it shouldn’t.
Common Questions About GraphRAG
Frequently Asked Questions
Fluree’s Advantage
While the broader market is just beginning to explore GraphRAG, Fluree has already solved the implementation challenges that keep most enterprises stuck at 80% accuracy. Here’s what sets Fluree apart:
1. Out-of-the-Box Enterprise Connectivity
What others require: Custom integration work for each data source, long development cycles to connect legacy systems.
What Fluree does: Out-of-the-box connectors to virtually any enterprise data or content system. From day one, data can be discovered and added to the semantic layer without custom development.
Your advantage: Connect Oracle, SAP, Salesforce, SharePoint, PDFs, APIs, and more—immediately. No six-month integration projects. No expensive middleware. Data flows into your knowledge graph as soon as you need it.
2. True Federated Query Capability
What others promise: Centralized data warehouses masquerading as "distributed" systems.
What Fluree delivers: Real federated queries across virtually any data store adhering to Knowledge Graph standards. Query spans multiple systems, multiple clouds, multiple geographies—in real-time, at query time.
Your advantage: Achieve the 95%+ accuracy of decentralized knowledge graphs without moving sensitive data across borders. Maintain data sovereignty while enabling global intelligence. Comply with GDPR, data residency requirements, and industry regulations automatically.
3. Dynamic, Adaptive Policy Management
What others offer: Static security rules defined once at implementation, requiring code changes to update.
What Fluree provides: Advanced logic within the ontology combined with policy-as-data enables dynamic policy updates that adapt automatically to context, risk level, and regulatory changes.
Your advantage: Compliance that evolves with your business. When regulations change, update policies without touching code. When risk profiles shift, security adapts automatically. When new data sources connect, governance extends seamlessly.
What This Means For Your Organization
If you’re leading enterprise AI initiatives, here’s the strategic takeaway:
You can use the most advanced language model in the world, but if you’re feeding it fragmented, poorly connected data, you’ll get impressive-sounding hallucinations.
The organizations winning with enterprise AI aren’t necessarily using different LLMs. They’re using better data architecture—specifically, semantic knowledge graphs that give LLMs the structured, explicit relationships they need to reason accurately.
Three Questions to Ask Your Team
- "When our AI gives an answer, can we trace it back to the source?" If no, you have an accuracy problem waiting to bite you. If yes, you’re ahead of most organizations.
- "How long does it take to connect a new data source to our AI?" If weeks or months, your architecture is brittle. If days, you’ve achieved the flexibility needed for AI evolution.
- "Do you fully trust your enterprise AI?" This question cuts to the heart of whether your AI implementation is truly production-ready and trustworthy enough for critical business decisions.
Getting Started: Your Next Steps
If semantic GraphRAG resonates with your challenges, here’s how to move forward:
- Identify Your Hallucination Pain. Where are inaccurate AI responses causing the most damage? Focus there first.
- Map Your Data Sources. List the systems that need to connect to answer that question. You probably have 5-10.
- Define Success Metrics. What accuracy rate would make you trust AI with this decision? 85%? 90%? 95%? Be specific.
- Build a Proof of Concept. Connect a subset of your data, implement basic semantic model, measure accuracy against baseline.
- Measure and Iterate. GraphRAG isn’t all-or-nothing. Start with high-value use case, prove ROI, expand from there.
The Bottom Line
Traditional RAG transformed LLMs from interesting demos to useful tools. But "useful" isn’t enough when you’re making million-dollar decisions or operating in regulated industries.
Semantic GraphRAG represents the next evolution: from tools that might be right to systems you can trust with critical business operations.
Fluree’s April 2024 study is clear: knowledge graphs deliver roughly 3x better zero-shot accuracy, and 90–99% accuracy with proper implementation. More importantly, every answer is verifiable, traceable, and governed by embedded security policies.
Gartner’s 2024 Emerging Tech Impact Radar: Generative AI places knowledge graphs at the center of its GenAI technology radar — no longer an emerging technology, but a critical enabler for enterprise AI. Organizations that adopt semantic GraphRAG now are building the foundation for the next decade of AI-driven business transformation.
Stay in the loop
Weekly insights on enterprise AI, knowledge graphs, and data intelligence.